Sierra Metals Announces Large Increase in Mineral Resource Tonnage at Its Yauricocha Mine in Peru and Positive Preliminary Economic Assessment for Increase in Throughput to 5,500 Tonnes Per Day From Today’s Permitted 3,150 Tonnes Per Day
Preliminary Economic Assessment Includes After Tax NPV of US$333 Million
TORONTO–(BUSINESS WIRE)–Sierra Metals Inc. (TSX: SMT) (BVL: SMT) (NYSE AMERICAN: SMTS) (“Sierra Metals” or “the Company”) is pleased to report the results of a Preliminary Economic Assessment (“PEA”) regarding the Company’s Yauricocha Mine, located in Peru.
This press release features multimedia. View the full release here: https://www.businesswire.com/news/home/20201118005337/en/
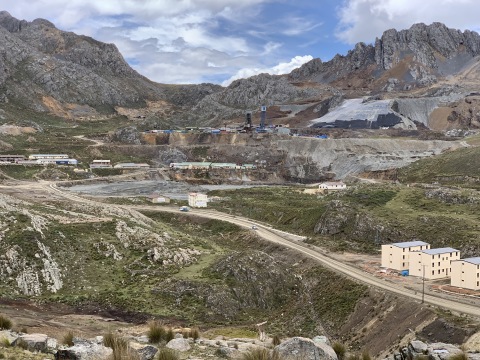
Photo 1: Yauricocha Mine, aerial view (Photo: Business Wire)
This PEA report was prepared as a National Instrument 43-101 Technical Report for Sierra Metals Inc. (“Sierra Metals”) by SRK Consulting (Canada) Inc. (“SRK”) and Sierra Metals. The full technical report will be filed on SEDAR within 45 days of this news release.
Highlights of the PEA include:
- After-tax Net Present Value (NPV): US$333 Million at an 8% discount rate
- Plant Processing Rate after expansion: 5,500 tonnes per day (TPD)
- Incremental benefit of increasing the production to 5,500 TPD from 3,780(1) TPD is estimated to have an after tax NPV (@8%) of US$27.1 Million, and IRR of 29.5%
- Net After-tax Cash Flow: US$495 Million
- Life of Mine & Sustaining Capital Cost: US$268.5 Million
- Total Operating Unit Cost: US$48.89/tonne and US$1.28/lb copper equivalent
- Average LOM Grades of Silver 34.2 g/t (1.1 oz/t), Copper 1.28%, Gold 0.42 g/t (0.01 oz/t), Zinc 1.71% and Lead 0.48%
- Copper Price Assumption US$3.05/lb
- Mine Life: 12 years based on updated Mineral Resource Estimate which includes a 26% increase in the measured and indicated resource category and a 79% increase in the inferred resource category
- Life of Mine Payable Production: Copper 419 million pounds, Silver 13.7 million troy ounces, Gold 43 thousand troy ounces, Zinc 541 million pounds, Lead 167 million pounds
(1) 3,780 Tonnes per dayrepresents the expected upcoming expansion to 3,600 tonnes per day plus a 5% overallotment allowance. Sierra is awaiting this permit from the government and hopes to receive it in Q1 2021.
Luis Marchese, CEO of Sierra Metals commented: “I am very encouraged by the results of this PEA which support the Company’s organic growth strategy and plan to profitably develop and grow the Yauricocha Mine production rate to 5,500 TPD in 2024 from today’s permitted capacity of 3,150 TPD, based on current analyst consensus metal price estimates. The Company plans to continue with its disciplined approach of profitable growth and now plans to proceed with the next step of the completion of a prefeasibility study to further de-risk the plan and determine the best path forward.”
He continued, “The PEA study compared the value of the current operations at Yauricocha against several output expansion alternatives from 5,500 to 7,500 TPD and determined 5,500 TPD as the optimum production level based on our current mineral resource base, while maintaining optionality for further growth. Additionally, we increased the measured and indicated mineral resource tonnage by 26% and we increased the inferred mineral resource tonnage by 79% demonstrating added potential and extended longevity for the Yauricocha Mine. Sierra Metals acquired the Yauricocha mine in 2011 with indicated resource of 5 million tonnes. Since then Sierra has mined 9.1 million tonnes of ore and today we are reporting the highest resource in the mine’s history at 16 million tonnes of measured and indicated mineral resources and 12 million tonnes of inferred mineral resources, reflecting the prolific exploration nature of the Yauricocha district. ”
He concluded, “We are continuing with our strategy to increase the value of the company on a per share basis. This includes demonstrating success with increasing our current mineral resource base and improving the throughput at all mines. We expect these positive developments to further improve profitability and cashflow for the Company and all shareholders this coming year as well as in the future.”
Updated Mineral Resource Estimate
The Yauricocha Mine is located in the Allis district, Yauyos province, department of Lima, approximately 12 kilometers west of the Continental Divide and 60 kilometers south of the Pachacayo railway station. Polymetallic mineralization has been mined at Yauricocha for more than 50 years. Mineralization is genetically and spatially related to the Yauricocha stock; six skarn bodies host mineral resources around the margins of the stock. Near surface mineral is exhausted but significant mineral resources are reported at depth.
This Preliminary Economic Assessment (PEA) considers the updated measured, indicated, and inferred resources shown below reported by SRK with an effective date as of June 30, 2020. The resource has not been depleted as part of this study.
Measured and Indicated Mineral Resources for Yauricocha are 15,924,000 tonnes averaging 43.8 g/t silver, 0.5 g/t gold, 1.2% copper, 0.6% lead and 2.2% zinc representing a 26% tonnage increase from the previous resource tonnage estimate.
Total Inferred Mineral Resources for Yauricocha are 11,633,000 tonnes averaging 27.5 g/t silver, 0.5 g/t gold, 1.4% copper, 0.3% lead and 1.0% zinc compared from the previous Resource Estimate, representing a 79% tonnage increase to the overall Inferred Resource Estimate.
Table 1-1: Summary of Mineral Resources estimate as reported by SRK, 2020 (Effective June 30, 2020)
| Resources – Measured and Indicated |
|
|
|
|
|
|
|
|
|
|
|
Contained Metal
|
|
|
|
|
Tonnes |
|
Ag |
|
Au |
|
Cu |
|
Pb |
|
Zn |
|
Ag |
|
Au |
|
Cu |
|
Pb |
|
Zn |
|
|
|
|
(000’s) |
|
g/t |
|
g/t |
|
% |
|
% |
|
% |
|
M oz |
|
K oz |
|
M lb |
|
M lb |
|
M lb |
| Yauricocha |
|
|
|
|
|
|
|
|
|
|
|
|
|
|
|
|
|
|
|
|
|
|
|
|
|
|
Measured |
|
4,904
|
|
55.8
|
|
0.6
|
|
1.1
|
|
0.8
|
|
2.6
|
|
8.8
|
|
93.5
|
|
122.2
|
|
89.4
|
|
280.1
|
|
|
Indicated |
|
11,020
|
|
38.4
|
|
0.5
|
|
1.2
|
|
0.5
|
|
2.1
|
|
13.6
|
|
178.0
|
|
291.1
|
|
126.7
|
|
498.9
|
|
|
Measured & Indicated |
|
15,924
|
|
43.8
|
|
0.5
|
|
1.2
|
|
0.6
|
|
2.2
|
|
22.4
|
|
271.5
|
|
413.3
|
|
216.2
|
|
779.0
|
|
|
Inferred |
|
11,633
|
|
27.5
|
|
0.5
|
|
1.4
|
|
0.3
|
|
1.0
|
|
10.3
|
|
167.4
|
|
357.9
|
|
79.3
|
|
242.5
|
Source: SRK, 2020
(1) Mineral Resources have been classified in accordance with the Canadian Institute of Mining, Metallurgy and Petroleum (“CIM”) Definition Standards on Mineral Resources and Mineral Reserves, whose definitions are incorporated by reference into NI 43-101.
(2) Mineral Resources are reported inclusive of Mineral Reserves. Mineral Resources are not Mineral Reserves and do not have demonstrated economic viability. All figures are rounded to reflect the relative accuracy of the estimates. Silver, gold, copper, lead, zinc, arsenic (deleterious) and iron assays were capped / cut where appropriate.
(3) The consolidated Yauricocha Resource Estimate is comprised of Measured, Indicated and Inferred material in the Mina Central, Cuerpos Pequeños, Cuye, Mascota, Esperanza and Cach-Cachi mining areas.
(4) Polymetallic Mineral Resources are reported at Cut-Off values (COV) based on 2020 actual metallurgical recoveries and 2020 smelter contracts.
(5) Metal price assumptions used for polymetallic feed considered CIBC, September 30, 2020 long-term consensus pricing (Gold (US$1,502/oz), Silver (US$18.24/oz), Copper (US$3.05/lb), Lead (US$0.91/lb), and Zinc (US$1.06/lb).
(6) Lead Oxide Mineral Resources are reported at COVs based on 2020 actual metallurgical recoveries and 2020 smelter contracts.
(7) Metal price assumptions used for lead oxide feed considered CIBC, September 30, 2020 long-term consensus pricing (Gold (US$1,502/oz), Silver (US$18.24/oz) and Lead (US$0.91/lb).
(8) The mining costs are based on 2020 actual costs and are variable by mining method.
(9) The unit value COVs are variable by mining area and proposed mining method. The marginal COV ranges from US$25 to US$36.
Mining Methodology
The Yauricocha Mine is a producing mining operation with a long production history. The majority of the mining is executed through mechanized sub-level caving with a relatively small portion of the mining using overhand cut and fill. The mine uses well-established, proven mining methods.
Mineral Processing
The Chumpe plant is located approximately one kilometer from the Yauricocha Mine and mineralized material is transported from the mine to the plant by rail. Mineralized material is processed using conventional two-stage crushing followed by grinding-classification and differential flotation circuit to produce commercial quality lead/silver, zinc and copper.
SRK is of the opinion that Yauricocha’s operations are reasonably well operated and shows flexibility to treat multiple mineralized material sources. The metallurgical performance, i.e., metal recovery and concentrate grade have been consistent throughout the period evaluated allowing them to produce commercial quality copper concentrate, copper concentrate, and zinc concentrate.
Economic Analysis
This PEA indicates an after tax NPV of US$333 million (using a discount rate of 8%) at 5,500 TPD (in 2024). Total operating cost for the life of mine is US$989 million, equating to a total operating cost of US$48.89 per tonne milled and US$1.28 per pound copper equivalent. Highlights of the PEA are provided in Table 1-2 below.
Table 1-2: PEA Highlights
|
PEA Highlights
Base case of $1,541/oz Gold, $20.00/oz Silver, $3.05/lb Copper, $1.07/lb Zinc, $0.91/lb Lead
|
|
Unit
|
|
Value
|
|
Net Present Value (After Tax 8% Discount Rate)
|
|
US$ M
|
|
333
|
|
|
|
|
|
|
|
LOM Mill Feed
|
|
Tonnes (Mt)
|
|
20.2
|
|
Mining Production Rate
|
|
Mt/year
|
|
1.98
|
|
LOM Project Operating Period
|
|
Years
|
|
12
|
|
Total Life of Mine (LoM) Capital Costs
|
|
US$ M
|
|
269
|
|
Net After – Tax Cashflow
|
|
US$ M
|
|
495
|
|
EBITDA
|
|
US$ M
|
|
1,144
|
|
Total Operating Unit Costs
|
|
US$/t
|
|
48.89
|
|
LOM Copper Production (Payable)
|
|
M lb
|
|
419
|
|
LOM Gold Production (Payable)
|
|
K oz
|
|
43
|
|
LOM Silver Production (Payable)
|
|
M oz
|
|
13.7
|
|
LOM Zinc Production (Payable)
|
|
M lb
|
|
541
|
|
LOM Lead Production (Payable)
|
|
M lb
|
|
167
|
Quality Control
All technical data contained in this news release has been reviewed and approved by:
Americo Zuzunaga, FAusIMM CP (Mining Engineer) and Vice President of Corporate Planning is a Qualified Person under National Instrument 43-101 – Standards of Disclosure for Mineral Projects.
Augusto Chung, FAusIMM CP (Metallurgist) and Vice President of Metallurgy and Projects to Sierra Metals is a Qualified Person under National Instrument 43-101 – Standards of Disclosure for Mineral Projects.
About Sierra Metals
Sierra Metals Inc. is a diversified Canadian mining company focused on the production and development of precious and base metals from its polymetallic Yauricocha Mine in Peru, and Bolivar and Cusi Mines in Mexico. The Company is focused on increasing production volume and growing mineral resources. Sierra Metals has recently had several new key discoveries and still has many more exciting brownfield exploration opportunities at all three Mines in Peru and Mexico that are within close proximity to the existing mines. Additionally, the Company also has large land packages at all three mines with several prospective regional targets providing longer-term exploration upside and mineral resource growth potential.
The Company’s Common Shares trade on the Bolsa de Valores de Lima and on the Toronto Stock Exchange under the symbol “SMT” and on the NYSE American Exchange under the symbol “SMTS”.
For further information regarding Sierra Metals, please visit www.sierrametals.com.
Continue to Follow, Like and Watch our progress:
Web: www.sierrametals.com | Twitter: sierrametals | Facebook: SierraMetalsInc | LinkedIn: Sierra Metals Inc | Instagram: sierrametals | Youtube: SierraMetals
Forward-Looking Statements
This press release contains “forward-looking information” and “forward-looking statements” within the meaning of Canadian and U.S. securities laws (collectively, “forward-looking information“). Forward-looking information includes, but is not limited to, statements with respect to the date of the 2020 Shareholders’ Meeting and the anticipated filing of the Compensation Disclosure. Any statements that express or involve discussions with respect to predictions, expectations, beliefs, plans, projections, objectives, assumptions or future events or performance (often, but not always, using words or phrases such as “expects”, “anticipates”, “plans”, “projects”, “estimates”, “assumes”, “intends”, “strategy”, “goals”, “objectives”, “potential” or variations thereof, or stating that certain actions, events or results “may”, “could”, “would”, “might” or “will” be taken, occur or be achieved, or the negative of any of these terms and similar expressions) are not statements of historical fact and may be forward-looking information.
Forward-looking information is subject to a variety of risks and uncertainties, which could cause actual events or results to differ from those reflected in the forward-looking information, including, without limitation, the risks described under the heading “Risk Factors” in the Company’s annual information form dated March 30, 2020 for its fiscal year ended December 31, 2019 and other risks identified in the Company’s filings with Canadian securities regulators and the United States Securities and Exchange Commission, which filings are available at www.sedar.com and www.sec.gov, respectively.
The risk factors referred to above are not an exhaustive list of the factors that may affect any of the Company’s forward-looking information. Forward-looking information includes statements about the future and is inherently uncertain, and the Company’s actual achievements or other future events or conditions may differ materially from those reflected in the forward-looking information due to a variety of risks, uncertainties and other factors. The Company’s statements containing forward-looking information are based on the beliefs, expectations and opinions of management on the date the statements are made, and the Company does not assume any obligation to update such forward-looking information if circumstances or management’s beliefs, expectations or opinions should change, other than as required by applicable law. For the reasons set forth above, one should not place undue reliance on forward-looking information.

View source version on businesswire.com: https://www.businesswire.com/news/home/20201118005337/en/
Mike McAllister
V.P., Investor Relations
Sierra Metals Inc.
Tel: +1 (416) 366-7777
Email: [email protected]
Americo Zuzunaga
V.P., Corporate Planning
Sierra Metals Inc.
Tel: +1 (416) 366-7777
Luis Marchese
CEO
Sierra Metals Inc.
Tel: +1 (416) 366-7777
KEYWORDS: North America United States Peru South America Canada
INDUSTRY KEYWORDS: Natural Resources Other Natural Resources Mining/Minerals
MEDIA:
| Photo |
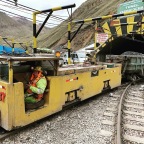 |
| Photo 3: Train emerging from Yauricocha Tunnel loaded with ore (Photo: Business Wire) |
| Photo |
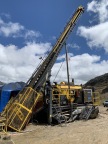 |
| Photo 2: Exploration Drilling at the Yauricocha Mine (Photo: Business Wire) |
| Photo |
 |
| Photo 1: Yauricocha Mine, aerial view (Photo: Business Wire) |